Have you ever found yourself feeling like your room is hotter during certain parts of the day, only to check the thermostat and see it is perfectly normal? Or maybe your room felt a little too warm compared to the weather outside?
I found myself wondering about this constantly. I wanted to know if my body was lying to me or if the room really did spike five degrees the moment the sun came up.
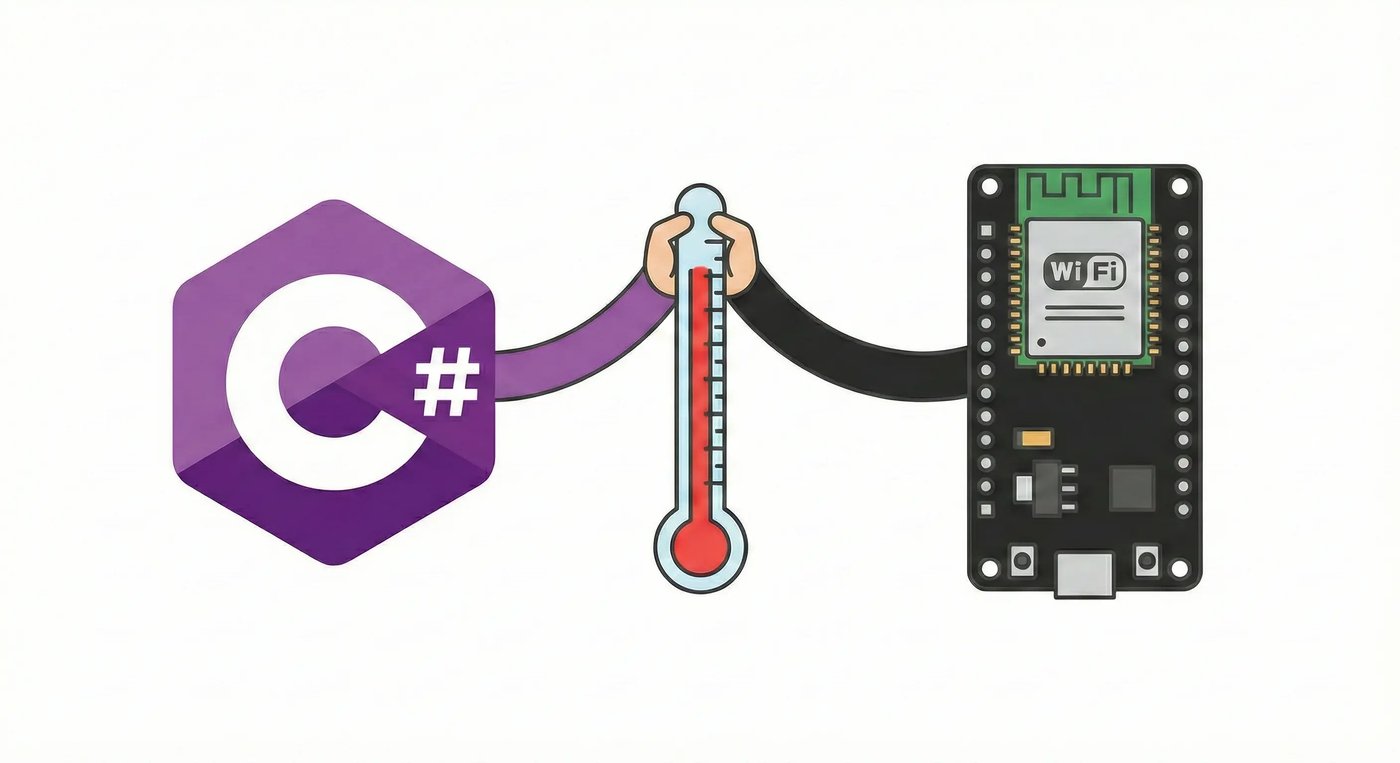
I could have solved this by buying a cheap wall thermometer, and it would have been the sensible solution, but a standard thermometer only tells you what is happening right now. It doesn't tell you a story and it certainly doesn't show you a graph of how the temperature fluctuated throughout the day. So in order to satisfy that curiosity, I decided to build my own system using an ESP32 controller, a BME280 sensor, and a C# backend to track the data.
The Hardware Setup
I chose the ESP32 because it is affordable and handles Wi-Fi without needing any extra components. For the sensor, I went with the BME280. It reads temperature, humidity, and atmospheric pressure. I find it generally reliable and more accurate than the cheaper DHT options which often drift. (Which funnily enough is what I'm currently using because my bme280 thermometer ended up breaking very recently)
The wiring relies on the I2C protocol. I connected the SDA and SCL pins from the sensor to the controller, gave it power, and that was about it. It is a small footprint that sits quietly on my desk.
The Firmware: ESP32 as a Server
I had to make a design choice on how to move the data. A common approach is to have the controller wake up and push data to a server (MQTT or HTTP POST). I decided to flip that.
I programmed the ESP32 to act as its own lightweight web server. It connects to my local Wi-Fi and listens for incoming requests. When queried, it reads the current state of the sensor and returns a JSON object. It doesn't store history or manage logical retention. It just answers the question "How hot is it right now?"
Here is the setup for the web server endpoint:
#include <WiFi.h>
#include <ESPAsyncWebServer.h>
#include <ArduinoJson.h>
#include <Wire.h>
#include <Adafruit_Sensor.h>
#include <Adafruit_BME280.h>

const char *ssid = "your_ssid";
const char *password = "your_password";

AsyncWebServer server(80);
Adafruit_BME280 bme;

void setup() {
  Wire.begin(); // Use Wire.begin(SDA_PIN, SCL_PIN) for custom pins

  // Initialize BME280 (try 0x76, then 0x77)
  if (!bme.begin(0x76) && !bme.begin(0x77)) {
    while (1) delay(1000); // Halt if sensor not found
  }

  WiFi.begin(ssid, password);
  while (WiFi.status() != WL_CONNECTED) delay(1000);

  server.on("/", HTTP_GET, [](AsyncWebServerRequest *request) {
    request->send(200, "text/html", "<html><body><h1>Hello, ESP32!</h1></body></html>");
  });

  server.on("/temp-info", HTTP_GET, [](AsyncWebServerRequest *request) {
    JsonDocument doc;
    String json;

    doc["temperature"] = bme.readTemperature();
    doc["humidity"] = bme.readHumidity();
    doc["pressure"] = bme.readPressure() / 100.0F; // Pa to hPa
    doc["unit"] = "Celsius";
    doc["pressure_unit"] = "hPa";

    serializeJson(doc, json);
    request->send(200, "application/json", json);
  });

  server.begin();
}

void loop() {}
The Backend: C# and PostgreSQL
Since the micro controller has limited memory, I needed something else to handle the long-term logging. I wrote a C# backend API to handle the heavy lifting which works on a polling loop. Every minute, it sends a request to the ESP32’s IP address. It grabs the JSON response, parses the values, and inserts them into a PostgreSQL database.
I also realized that I don't need to keep this data forever. Knowing the temperature of my room on a Tuesday four years ago isn't useful. To keep the database size manageable, I added logic to wipe any records older than 3 months. This gives me a full season of context without wasting space.
Here is the C# logic that handles the polling and storage:
using Microsoft.AspNetCore.SignalR;
using Temp_Info_Logger.Clients;
using Temp_Info_Logger.Database;
using Temp_Info_Logger.Database.Entities;
using Temp_Info_Logger.SignalRHubs;

namespace Temp_Info_Logger.Services;

public class BackgroundTempFetcher(IServiceProvider serviceProvider) : BackgroundService
{
    protected override async Task ExecuteAsync(CancellationToken stoppingToken)
    {
        var nextRun = DateTime.UtcNow;

        while (!stoppingToken.IsCancellationRequested)
        {
            if (DateTime.UtcNow < nextRun)
            {
                await Task.Delay(100, stoppingToken);
                continue;
            }

            try
            {
                using var scope = serviceProvider.CreateScope();
                var tempClient = scope.ServiceProvider.GetRequiredService<TemperatureClient>();
                var db = scope.ServiceProvider.GetRequiredService<TemperatureDatabaseContext>();
                var hub = scope.ServiceProvider.GetRequiredService<IHubContext<TemperatureHub>>();

                var info = await tempClient.GetTemperatureInfoAsync();
                if (info == null) continue;

                var record = new TempRecord
                {
                    Timestamp = DateTime.UtcNow,
                    Temperature = Math.Round(info.Temperature, 2),
                    Humidity = Math.Round(info.Humidity, 2),
                    Pressure = Math.Round(info.Pressure, 2)
                };

                db.TempRecords.Add(record);

                // Purge records older than 3 months
                var cutoff = DateTime.UtcNow.AddMonths(-3);
                db.TempRecords.RemoveRange(db.TempRecords.Where(r => r.Timestamp < cutoff));

                await db.SaveChangesAsync(stoppingToken);
                await hub.Clients.All.SendAsync("LatestTemperatureUpdated", record, stoppingToken);
            }
            catch { /* retry next cycle */ }
            finally
            {
                nextRun = nextRun.AddMinutes(1);
            }
        }
    }
}
The Interface
The main reason I built this was to see the charts. I created a web interface that pulls the data from my C# API and visualizes it.
Below is a screenshot of the current dashboard. You might notice the temperature line looks a bit blocky and "flat" in places. My trusty BME280 actually broke recently, so I had to swap it out for a less precise DHT11 sensor while I wait for a replacement. It doesn't have the same resolution, leading to those step-like changes, but it still does the job of showing the overall trend.
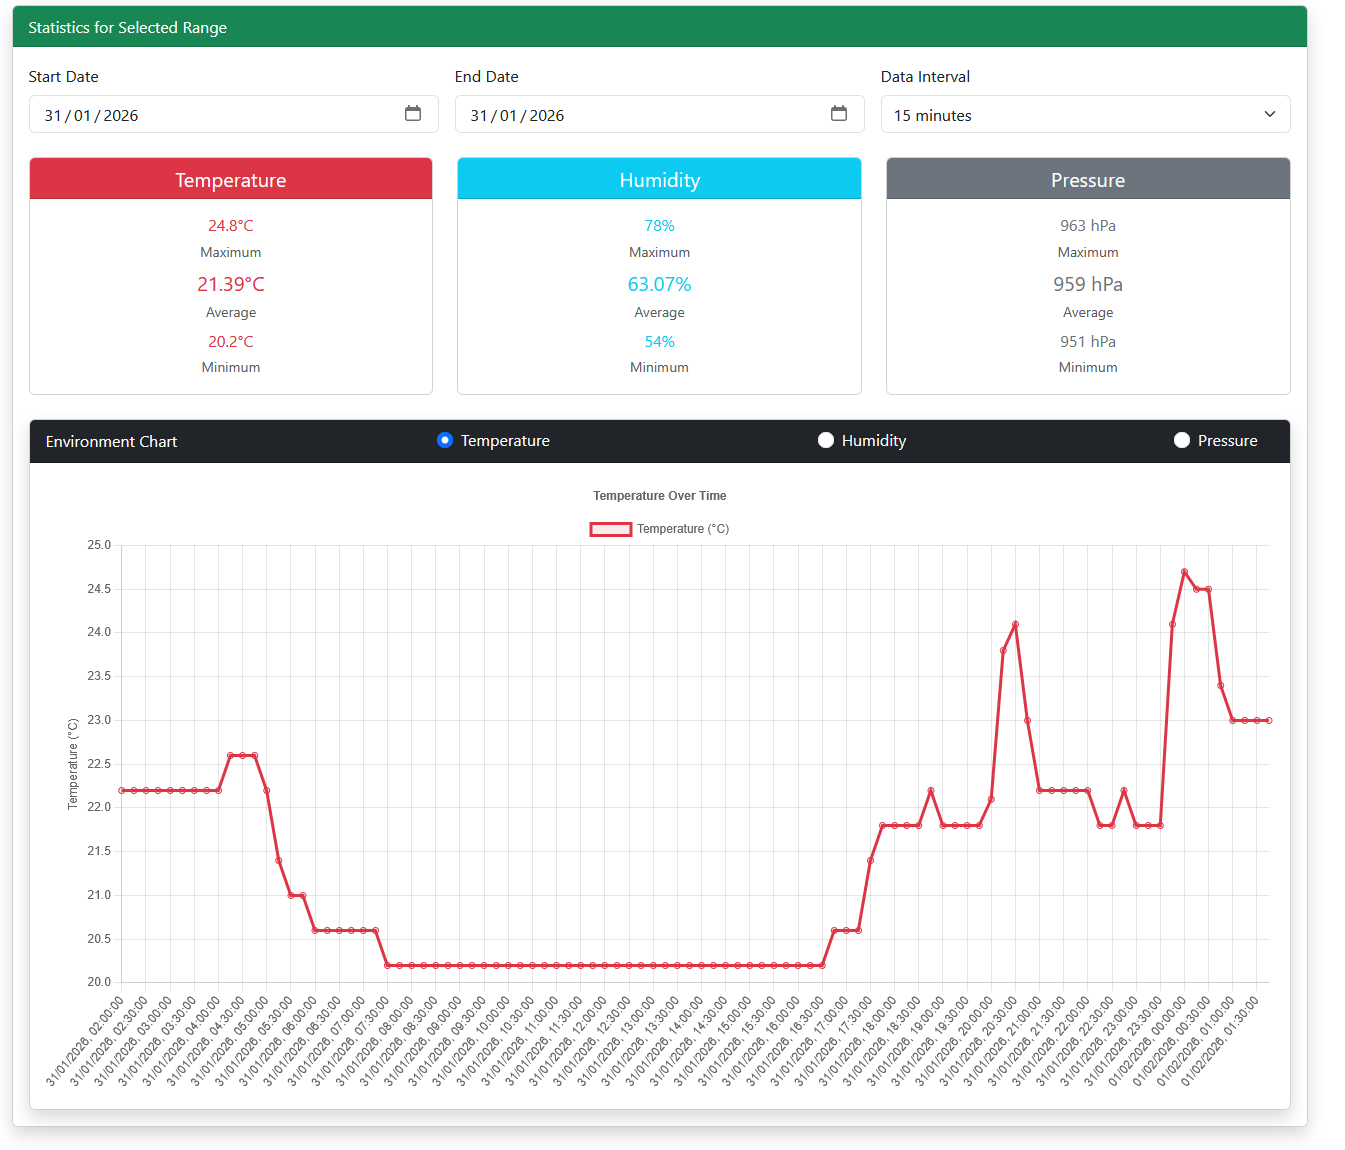
Even with the temporary sensor, the line graph makes the invisible visible. I can see the exact slope of the temperature rising when the sun hits the window, and the sharp drop when I open the balcony door. It confirms my suspicions about when the room gets stuffy and validates my complaints when it gets too cold.
Conclusion
This project was admittedly overkill for simply knowing if I should put on a sweater. However, having a granular history of my environment is surprisingly satisfying. I can check my room status from another room or even from outside the house to see if I left a window open. Most importantly, I finally have the data to prove that, yes, it really is getting too hot in here.
